
REAL ESTATE REVIEW
The real story of what's been happening with homes like yours.
A free two-page report, built from MLS data for your neighborhood and matched to homes like yours.
THE WHOLE PICTURE
Every home, not a handpicked few.
The Real Estate Review starts with every home in your neighborhood: what sold, what's under contract, what's still sitting, and what never sold at all.
Drawn on your neighborhood's boundaries, not a zip code.
Then it's matched to homes like yours by bedrooms, bathrooms, and square footage. So you're seeing the whole picture, compared fairly.
FOUR GRAPHS
What each one shows.
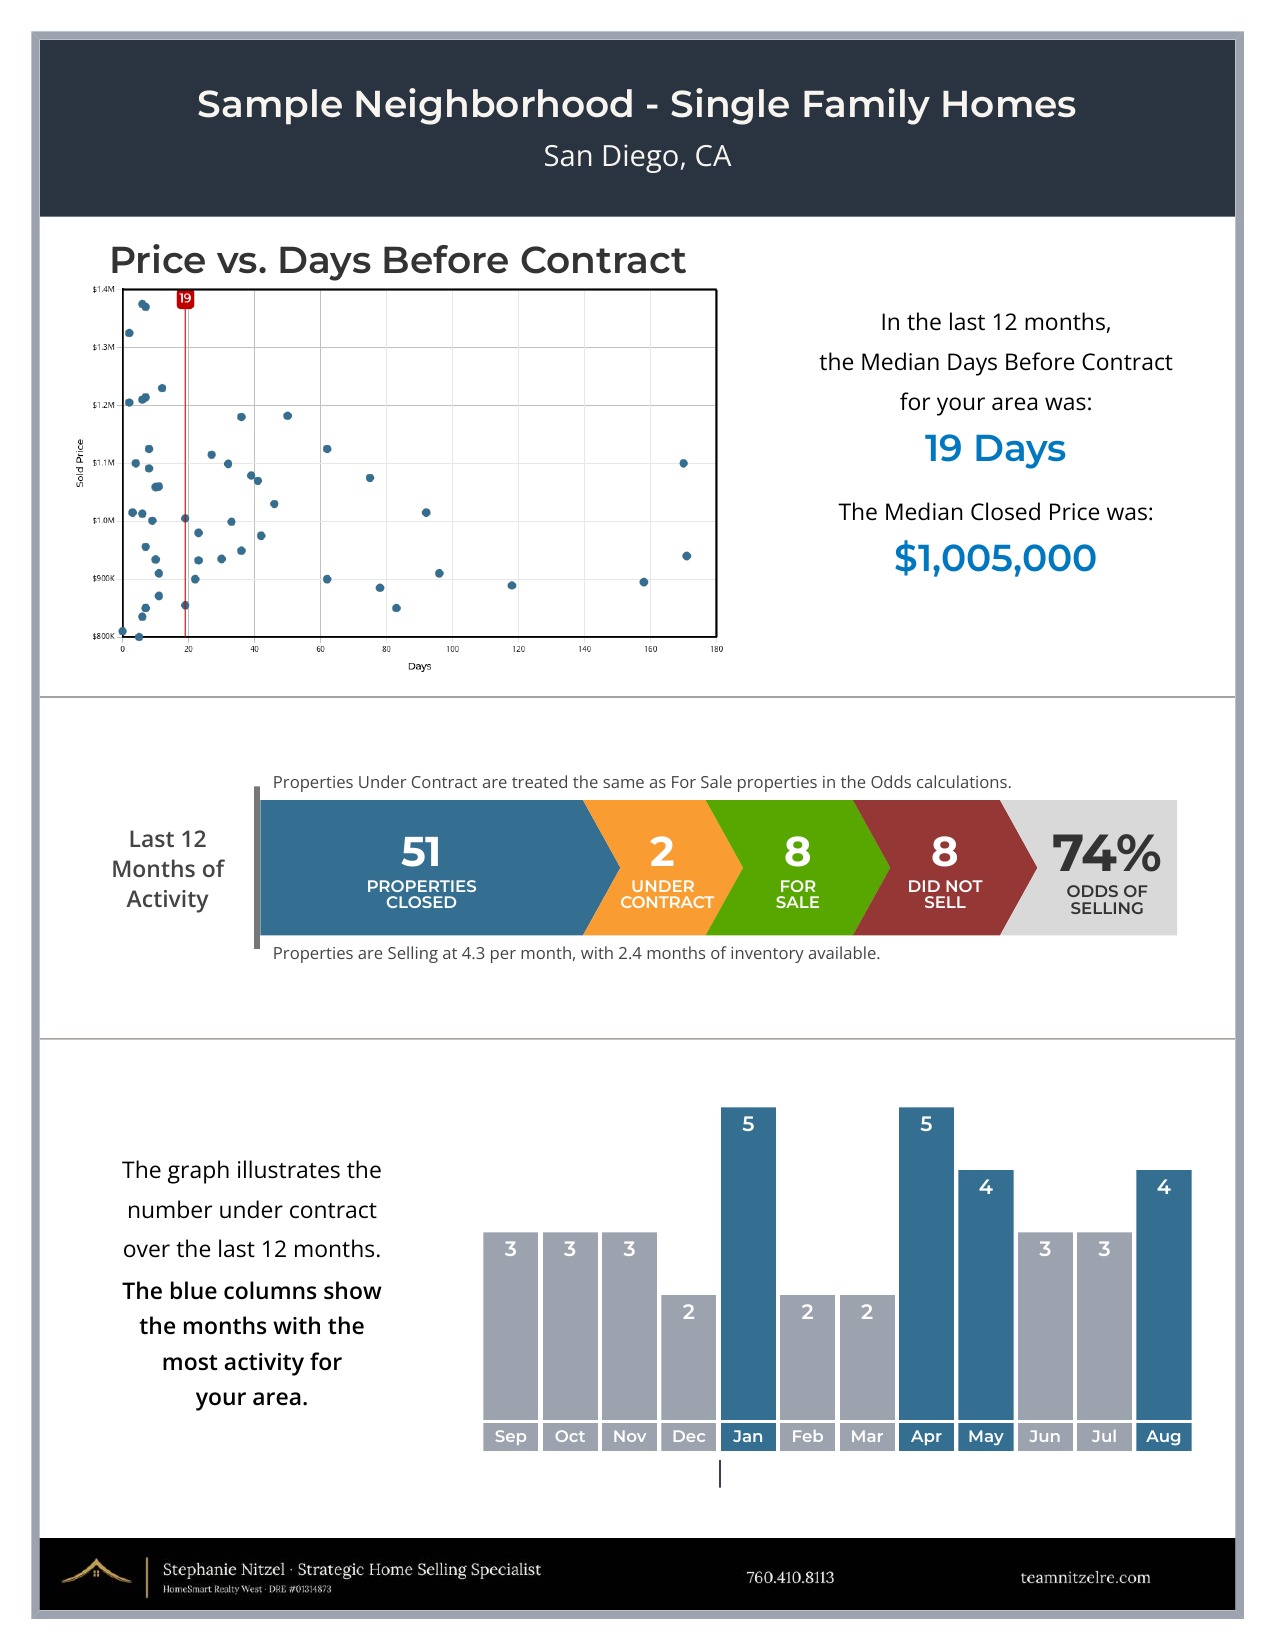
Price and days before contract. How quickly homes went under contract, and the prices they closed at.
Odds of selling. How many homes closed, went under contract, are still for sale, and never sold at all. This is the one graph that counts the homes that didn't sell. It matters more than people expect: a neighborhood where the odds sit in the eighties or nineties is a different place to price a home than one where they sit in the thirties.
Buying pattern. How many homes went under contract each month, so you can see when buyers have been most active through the year.
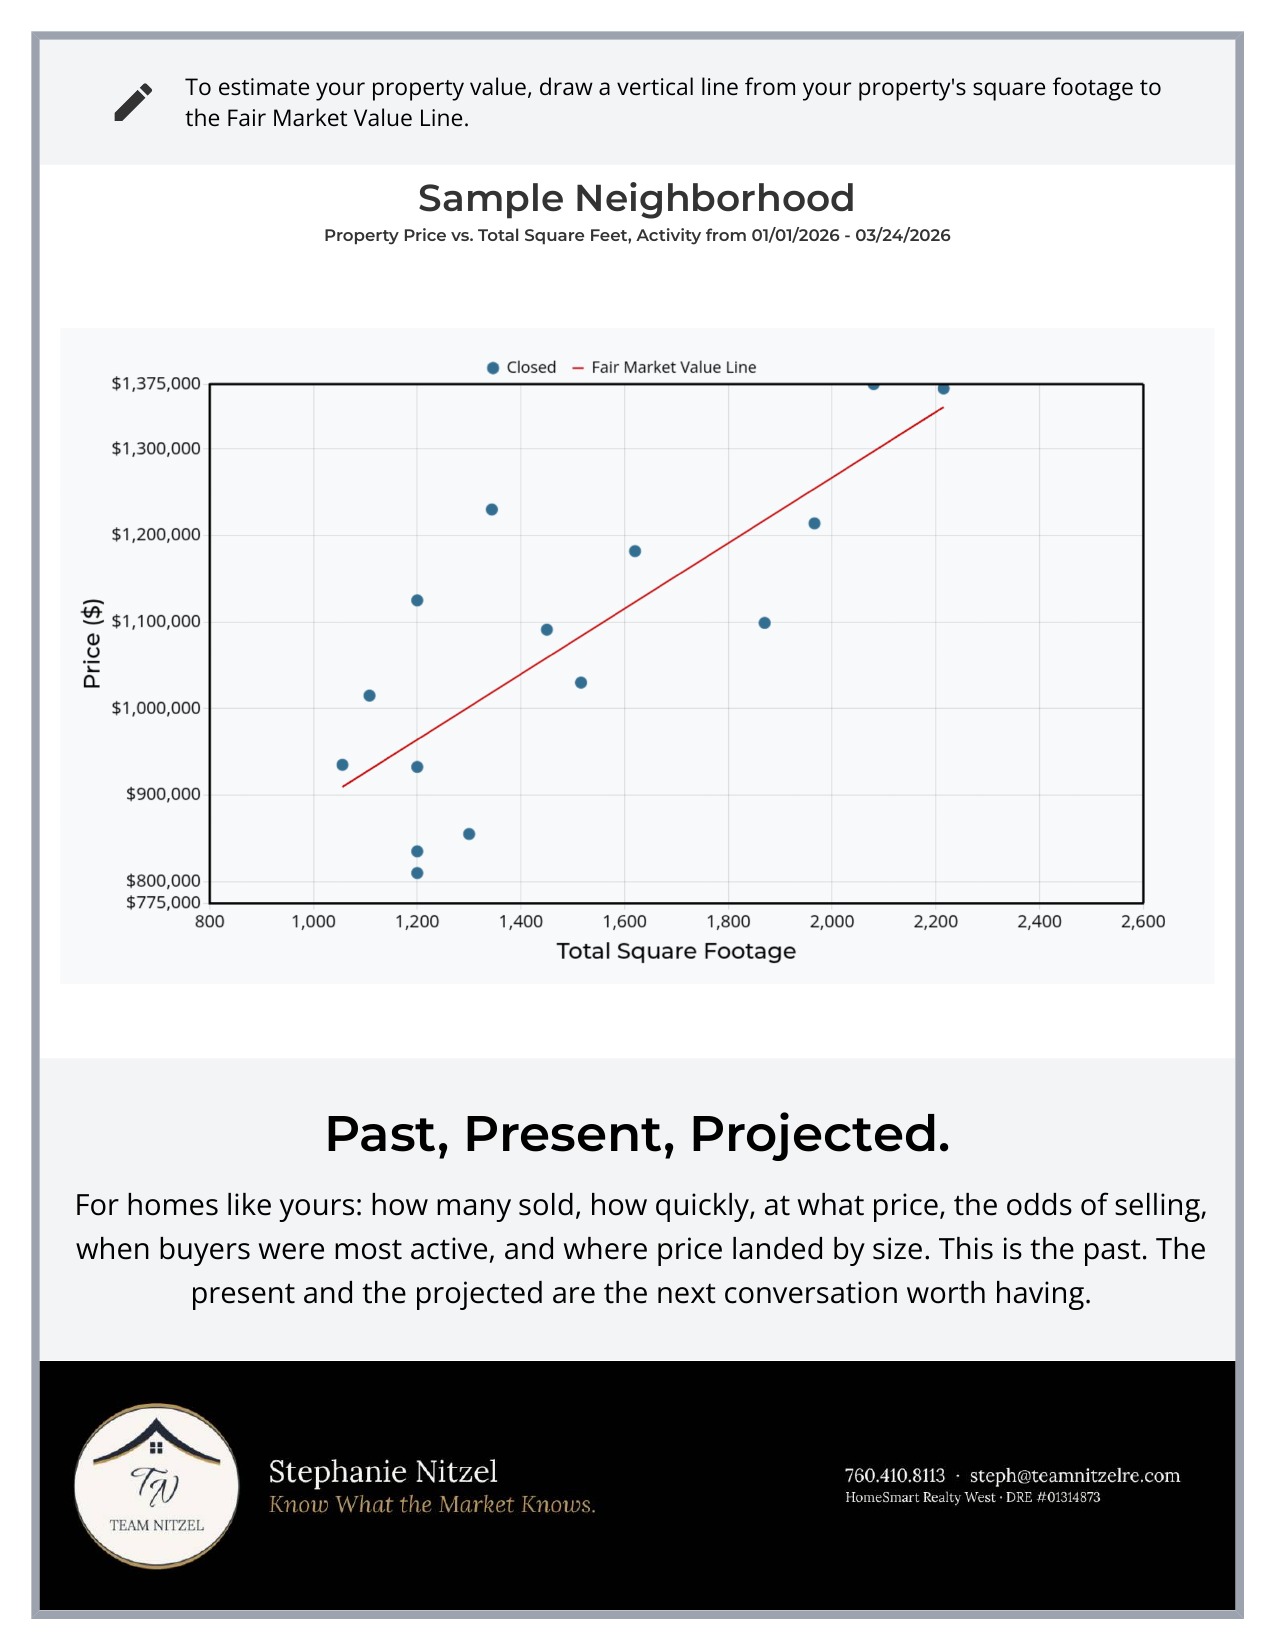
Price and square footage. Each closed sale plotted by price and size, with a trend line running through them. The line is the pattern across those sales, where price and size have generally lined up. It isn't a value for any one home. Find your size along the bottom and see where homes like yours landed. This graph represents a shorter stretch of time than the other three.
A SAMPLE
What a Real Estate Review looks like.
A sample Real Estate Review for one San Diego neighborhood. Yours will be drawn on your neighborhood's own boundaries.
PAST, PRESENT, PROJECTED
The Real Estate Review is the Past.
It isn't a price for your home. It's the picture a price would sit inside.
A Competitive Market Analysis is a separate conversation. It narrows the focus to your home, adds the homes you'd be competing with right now, and looks at what the next few months are likely to hold.
Know What the Market Knows.
Stephanie Nitzel · Team Nitzel
HomeSmart Realty West · DRE #01314873
Privacy Policy · Terms of Service · Cookie Policy
© 2026 Team Nitzel · Equal Housing Opportunity